Table of Contents
> [Prerequisites](#prerequisites) > [Data Background](#data-background) > > [Import and transform dirty data](#import-and-transform-dirty-data) > > [Clean the data](#clean-the-data) > > [Take Away](#take-away)
Prerequisites
- Excel file with uncleaned data
- Power BI
Data Background
A raw dataset with greenhouse gases emissions, economic, and industrial profiles for Southeast Asian region. The dataset is structured as an excel file with each row representing data/values for specific country or region obtained between 1889 to 2018. Each column representing parameters. Here’s a general idea of what the structure could look like:
| location information | time period | carbon emission sources | carbon consumption | capita | total greenhouse gases | population |
|---|---|---|---|---|---|---|
| Philippines | 2023 | # | # | # | # | # |
This dataset was provided by Eskwelabs. Intentionally left uncleaned for training purposes.
Import and transform dirty data
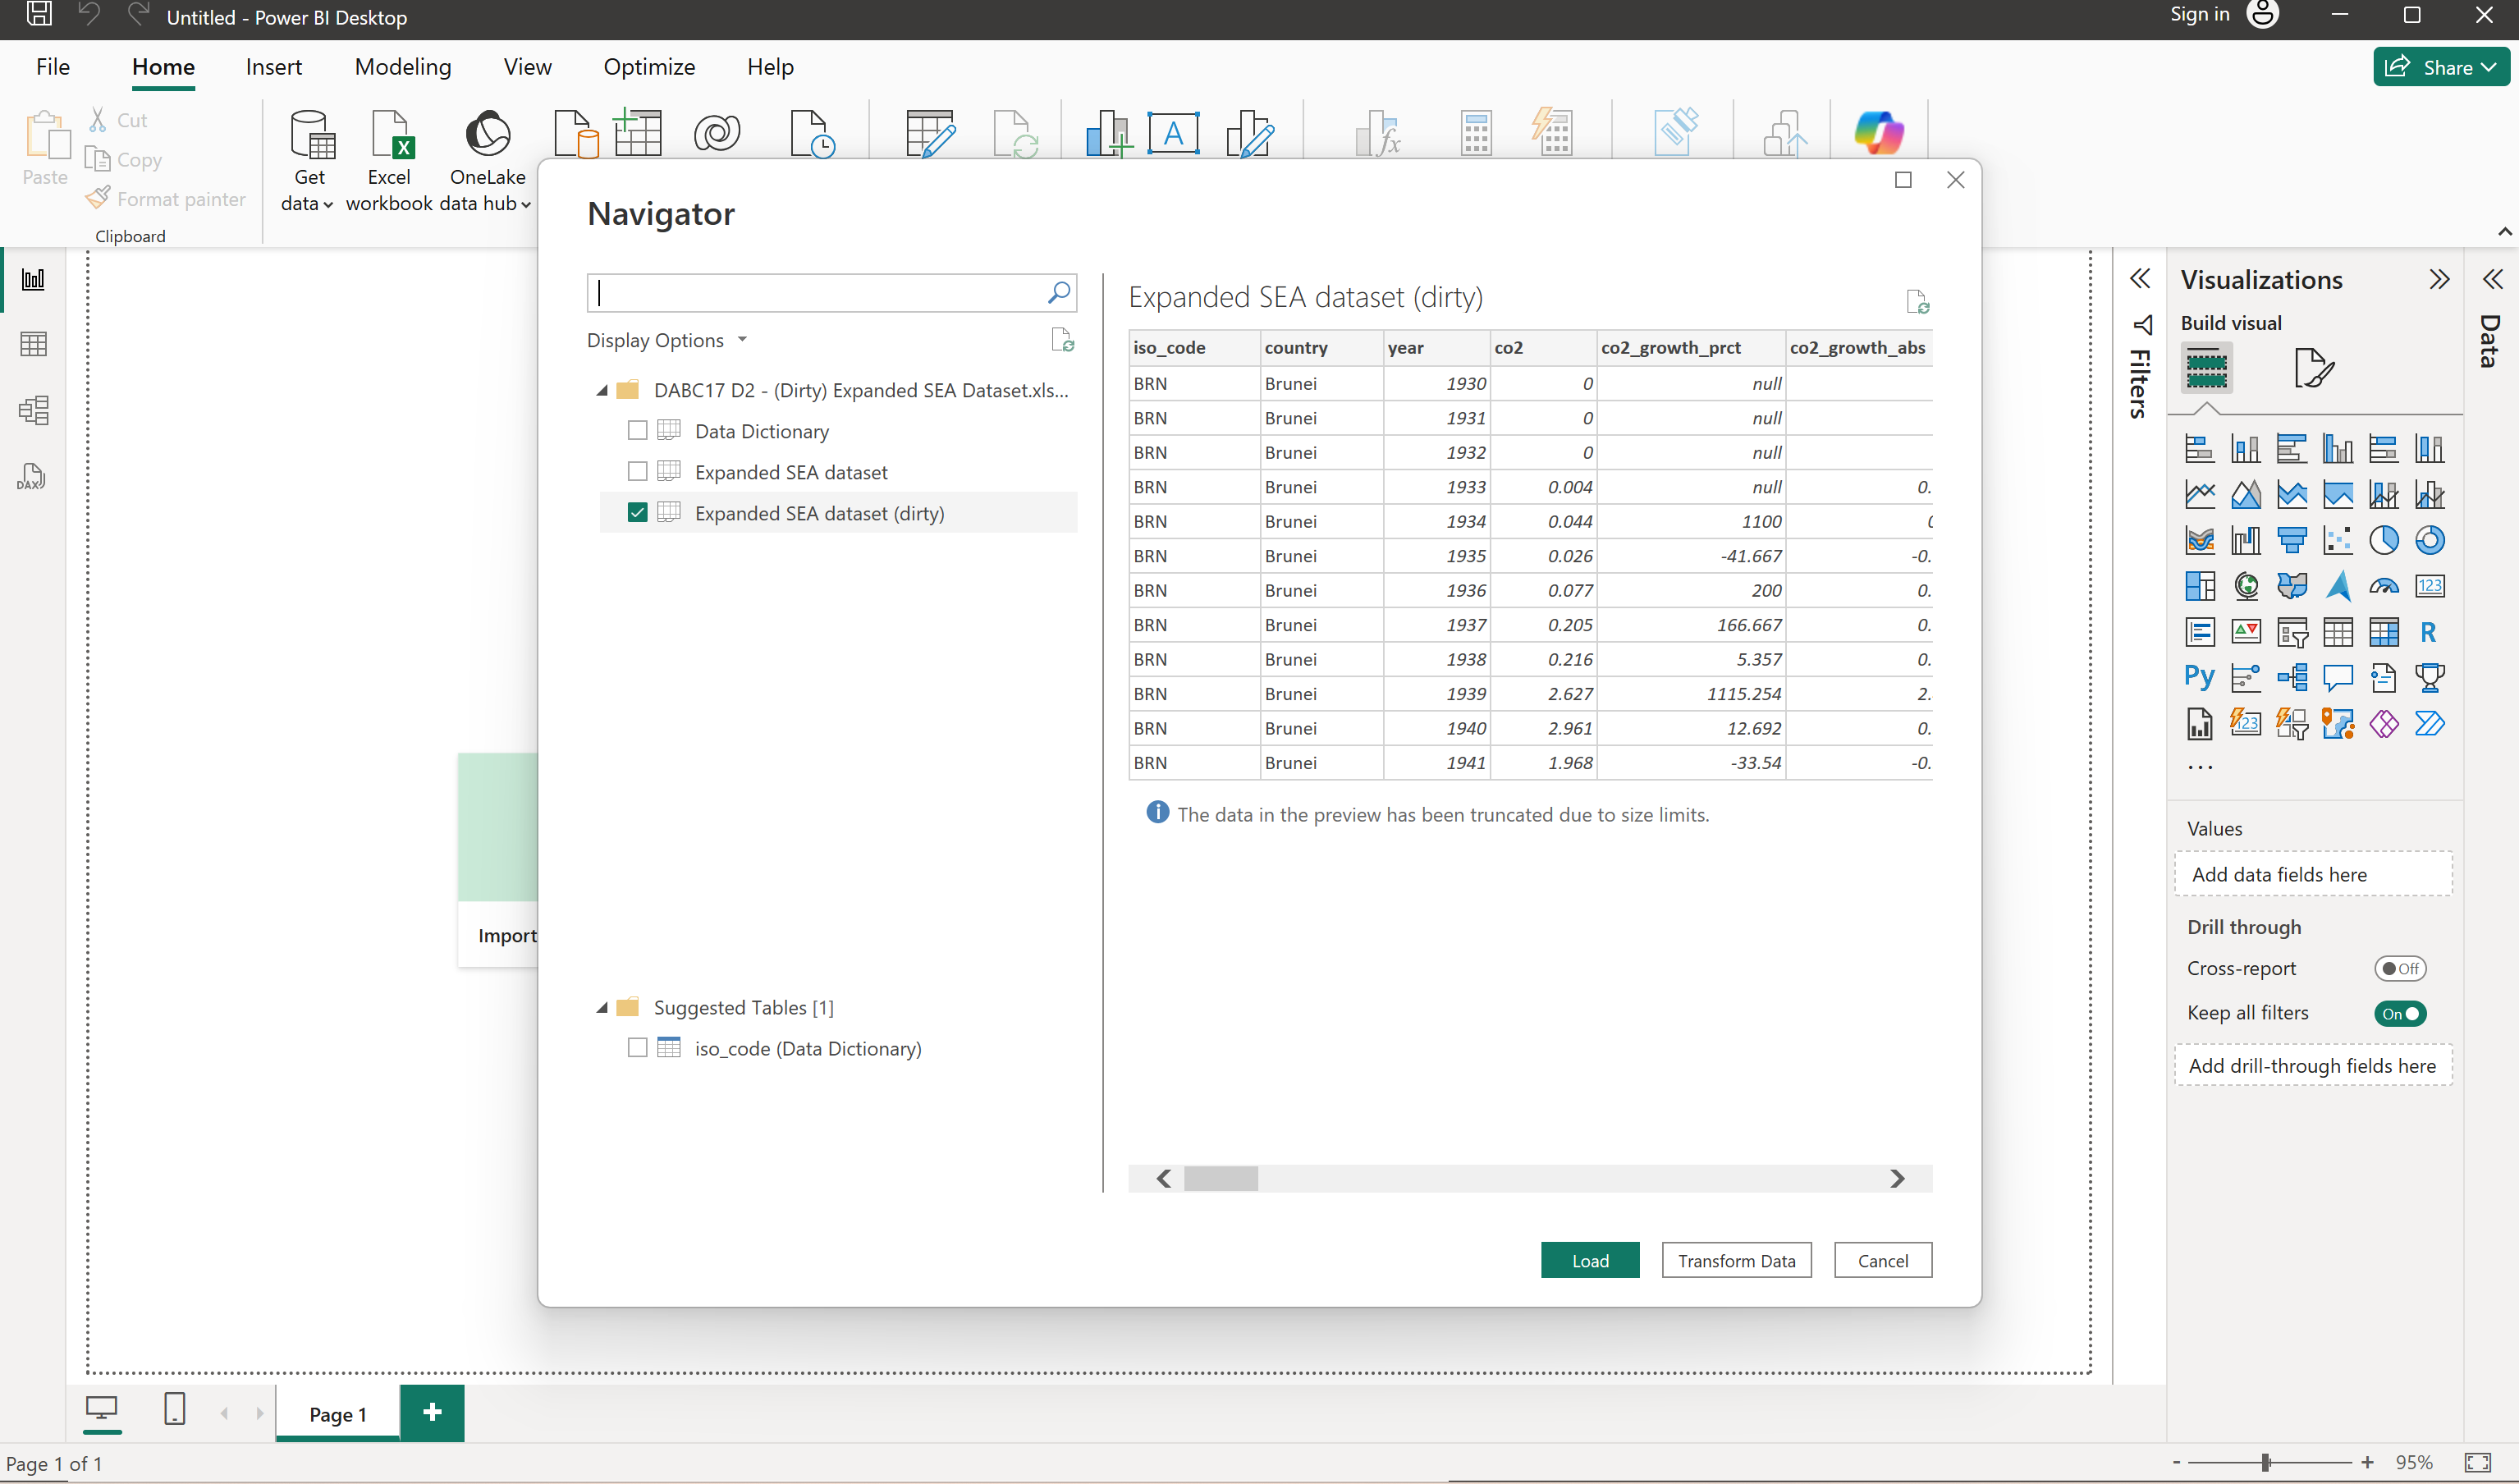
Once you load Power BI, this image will be prompted.

Add the uncleaned data in .xlsx format by clicking the Import data from Excel. On the navigator ribbon, click the data of interest.
For this demo, we chose the Expanded SEA dataset (dirty).
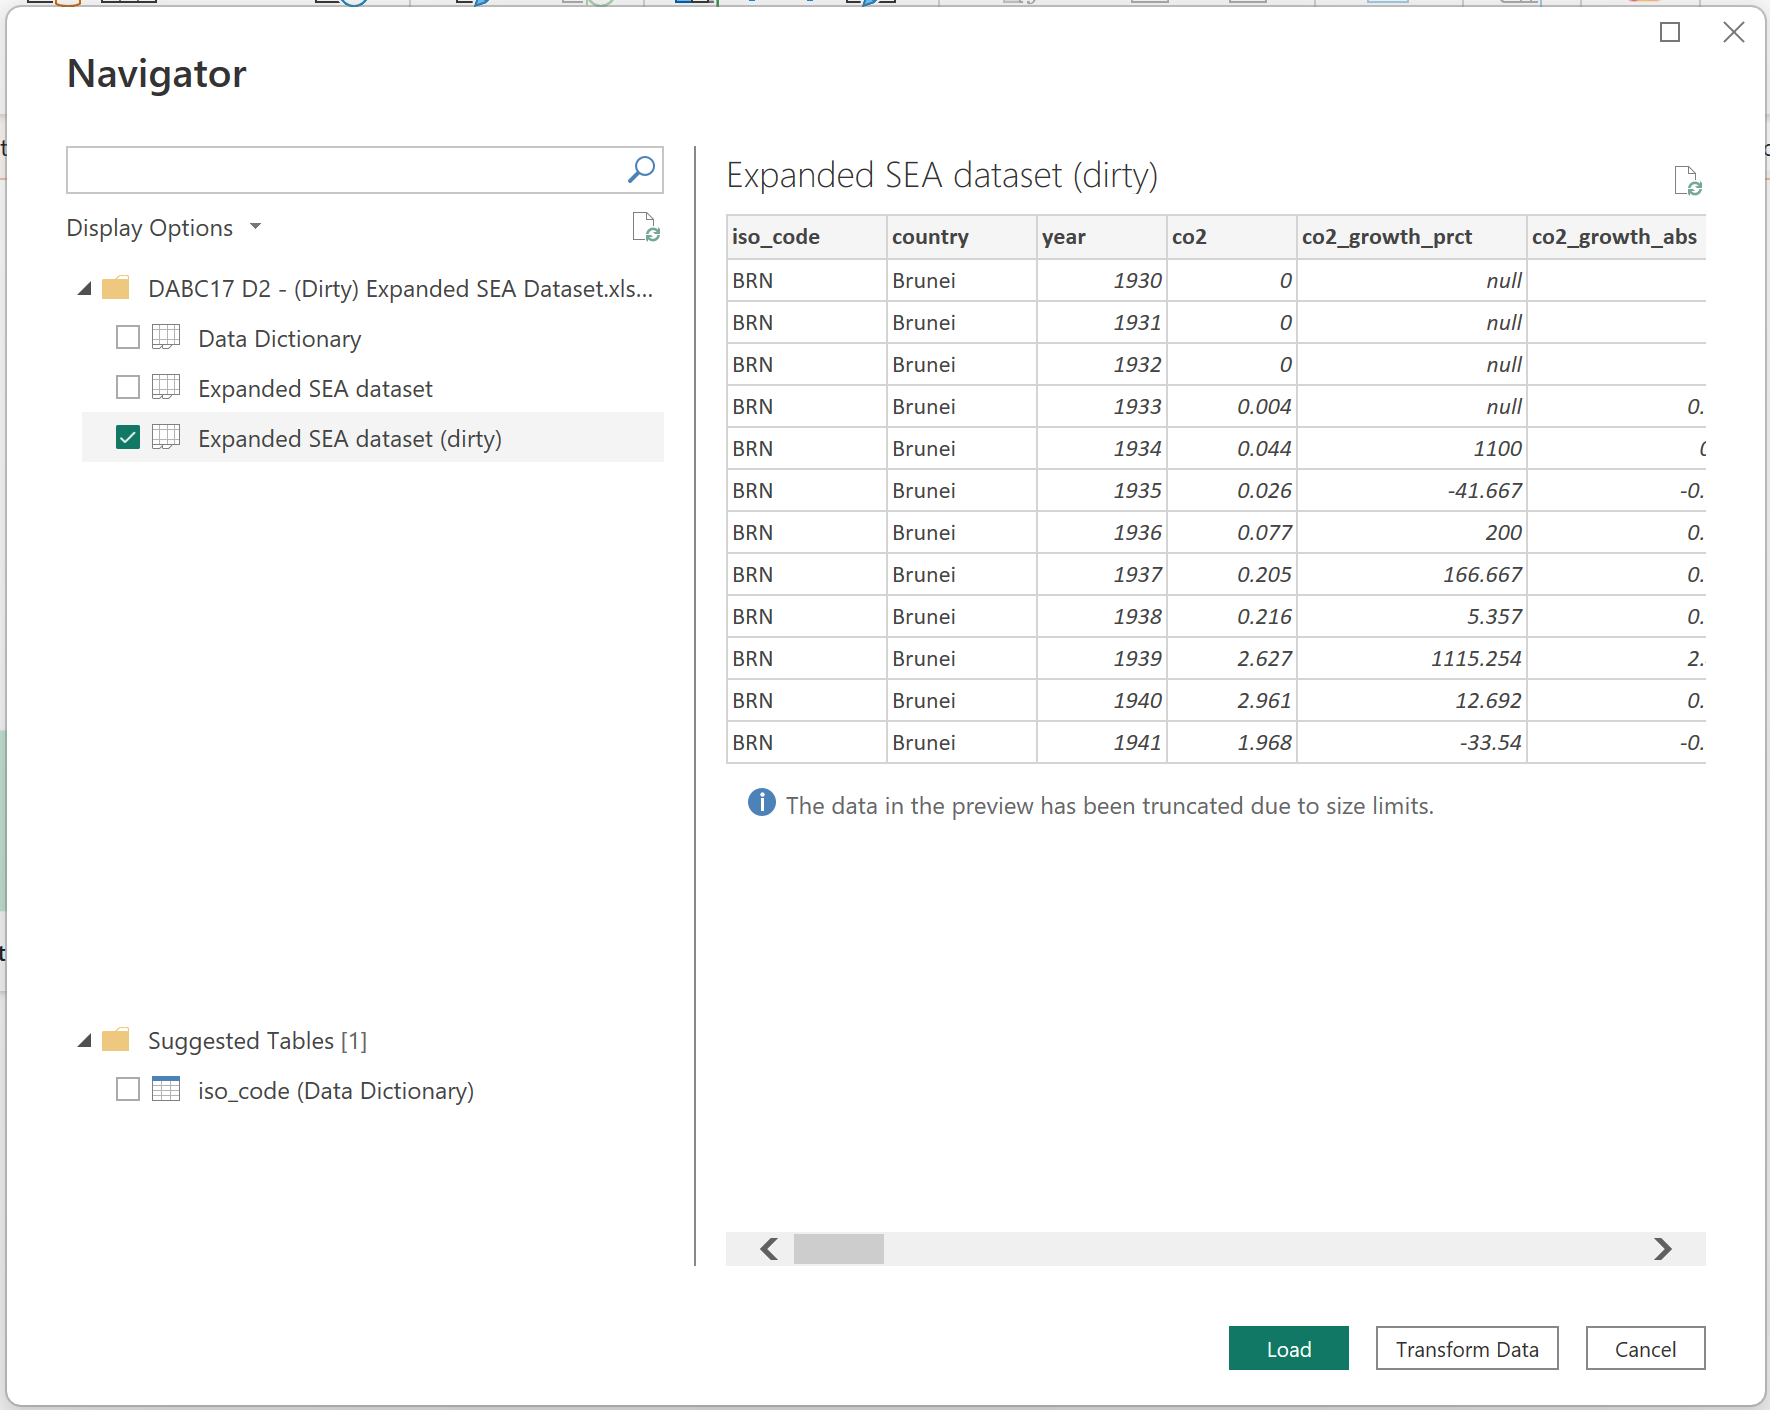
If you initially click the load, Power BI will prompt error messages. Instead, click transform to check errors and validity status of data.
You will be redirected to the Power Query user interface to edit your uncleaned data.
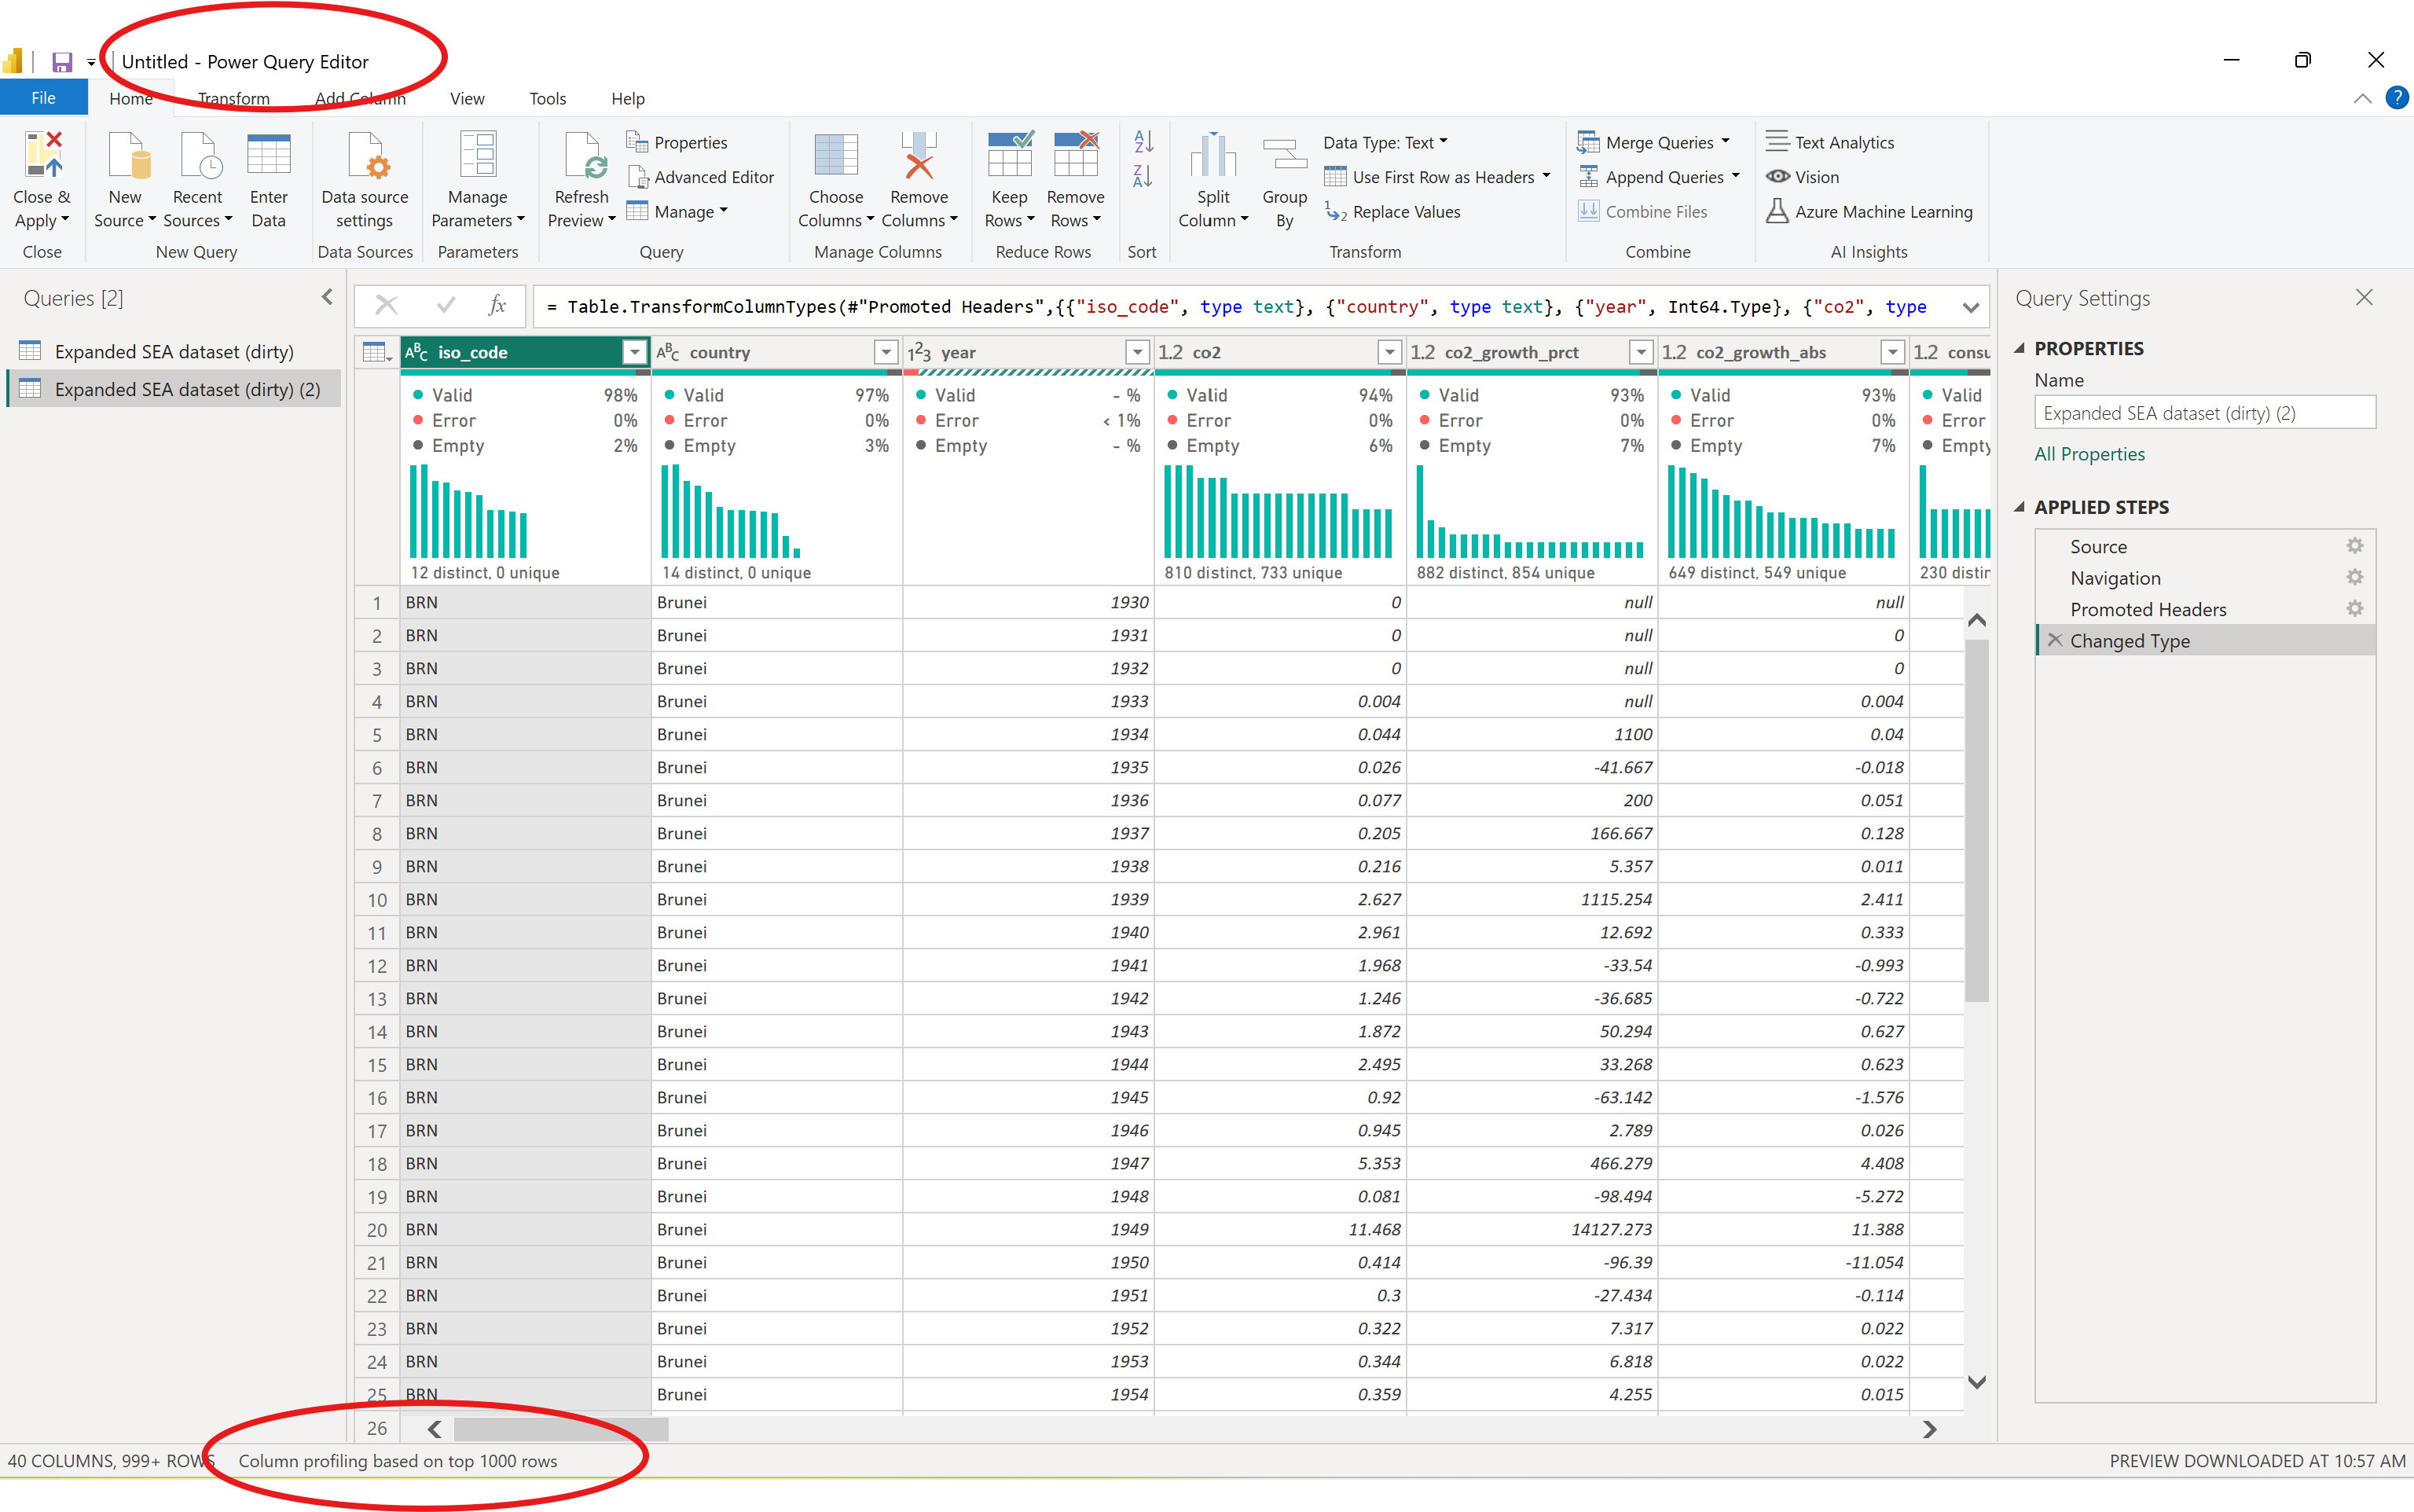
Notice the encircled details. The current Power Query editor profile is based on 1000 samples only, click on that and choose an option covering the entire dataset.
Clean the Data
You are now here!
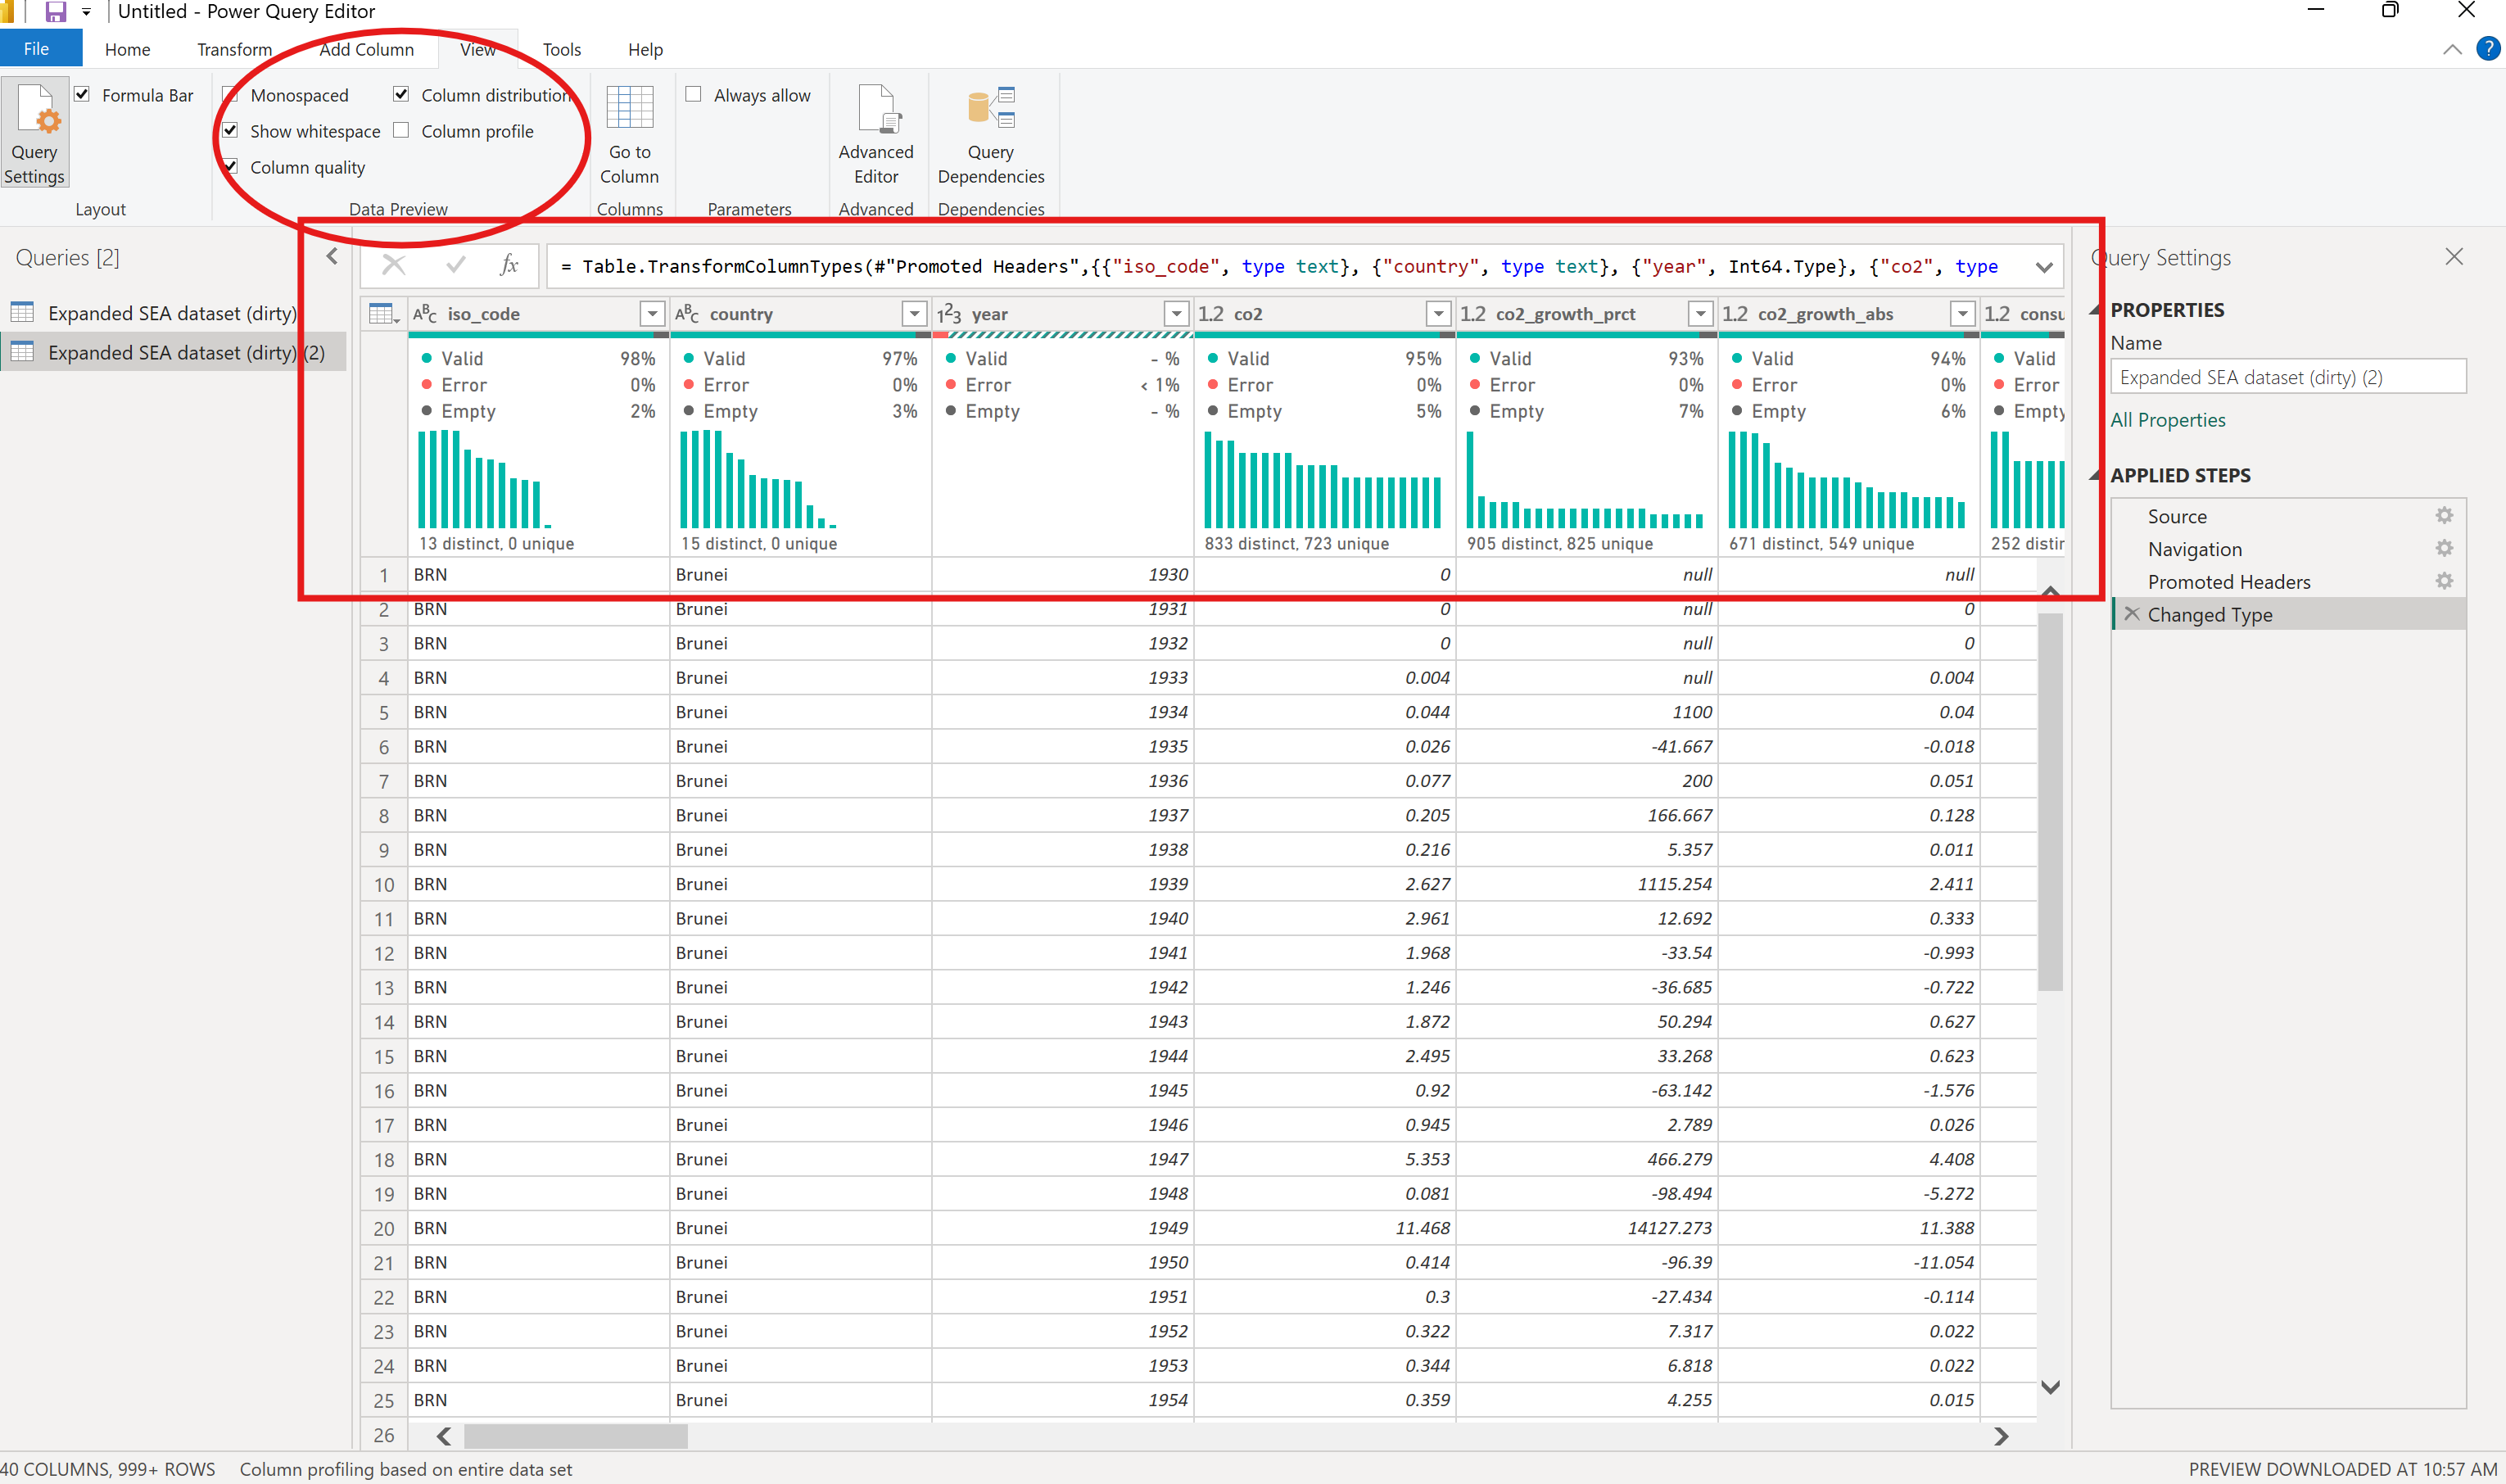 The data preview (encircled) provides insights into the percent validity, errors, and empty profile of the dataset (boxed).
Use this as a guide to clean data per column.
Let’s begin cleaning!
[1] iso_code
Observation
With 98% valid and 2% empty data.
Solution
Sort data in ascending order
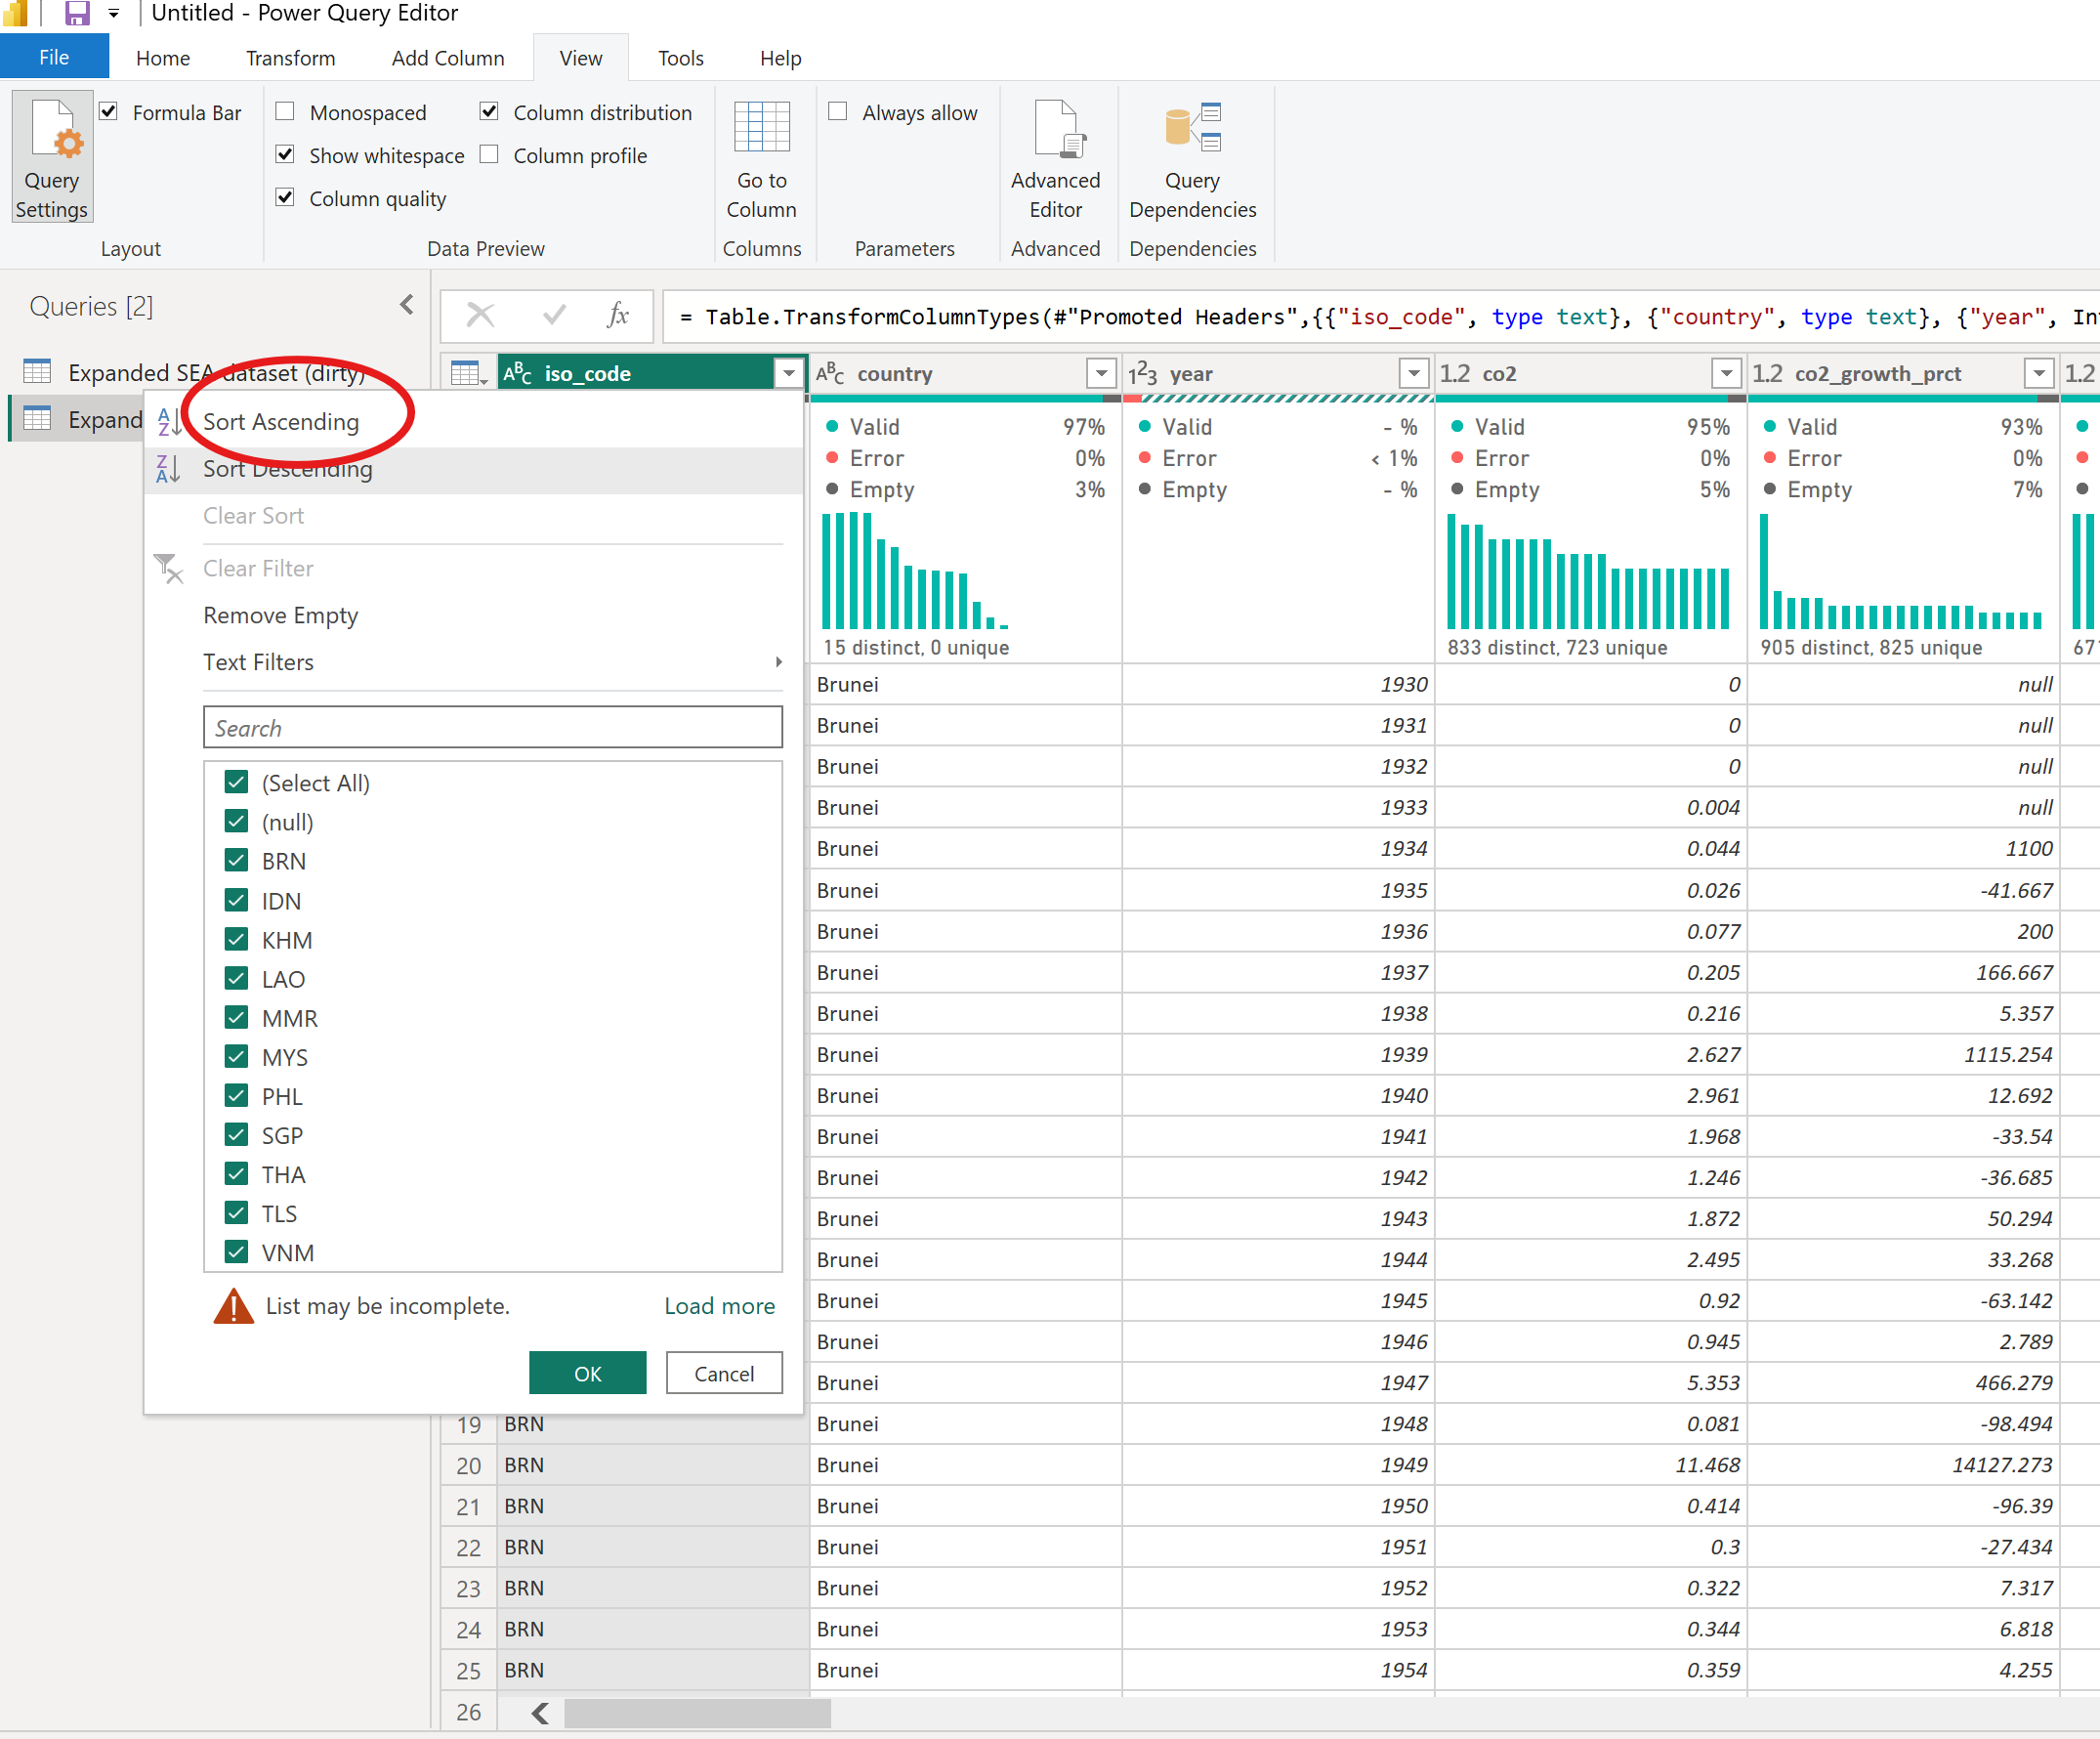
Check other columns before removing the null. Here, you see that there are 13 empty rows. Remove these empty rows but be careful not to include rows with contents
Go to Home → Remove Rows → Remove Blank Rows
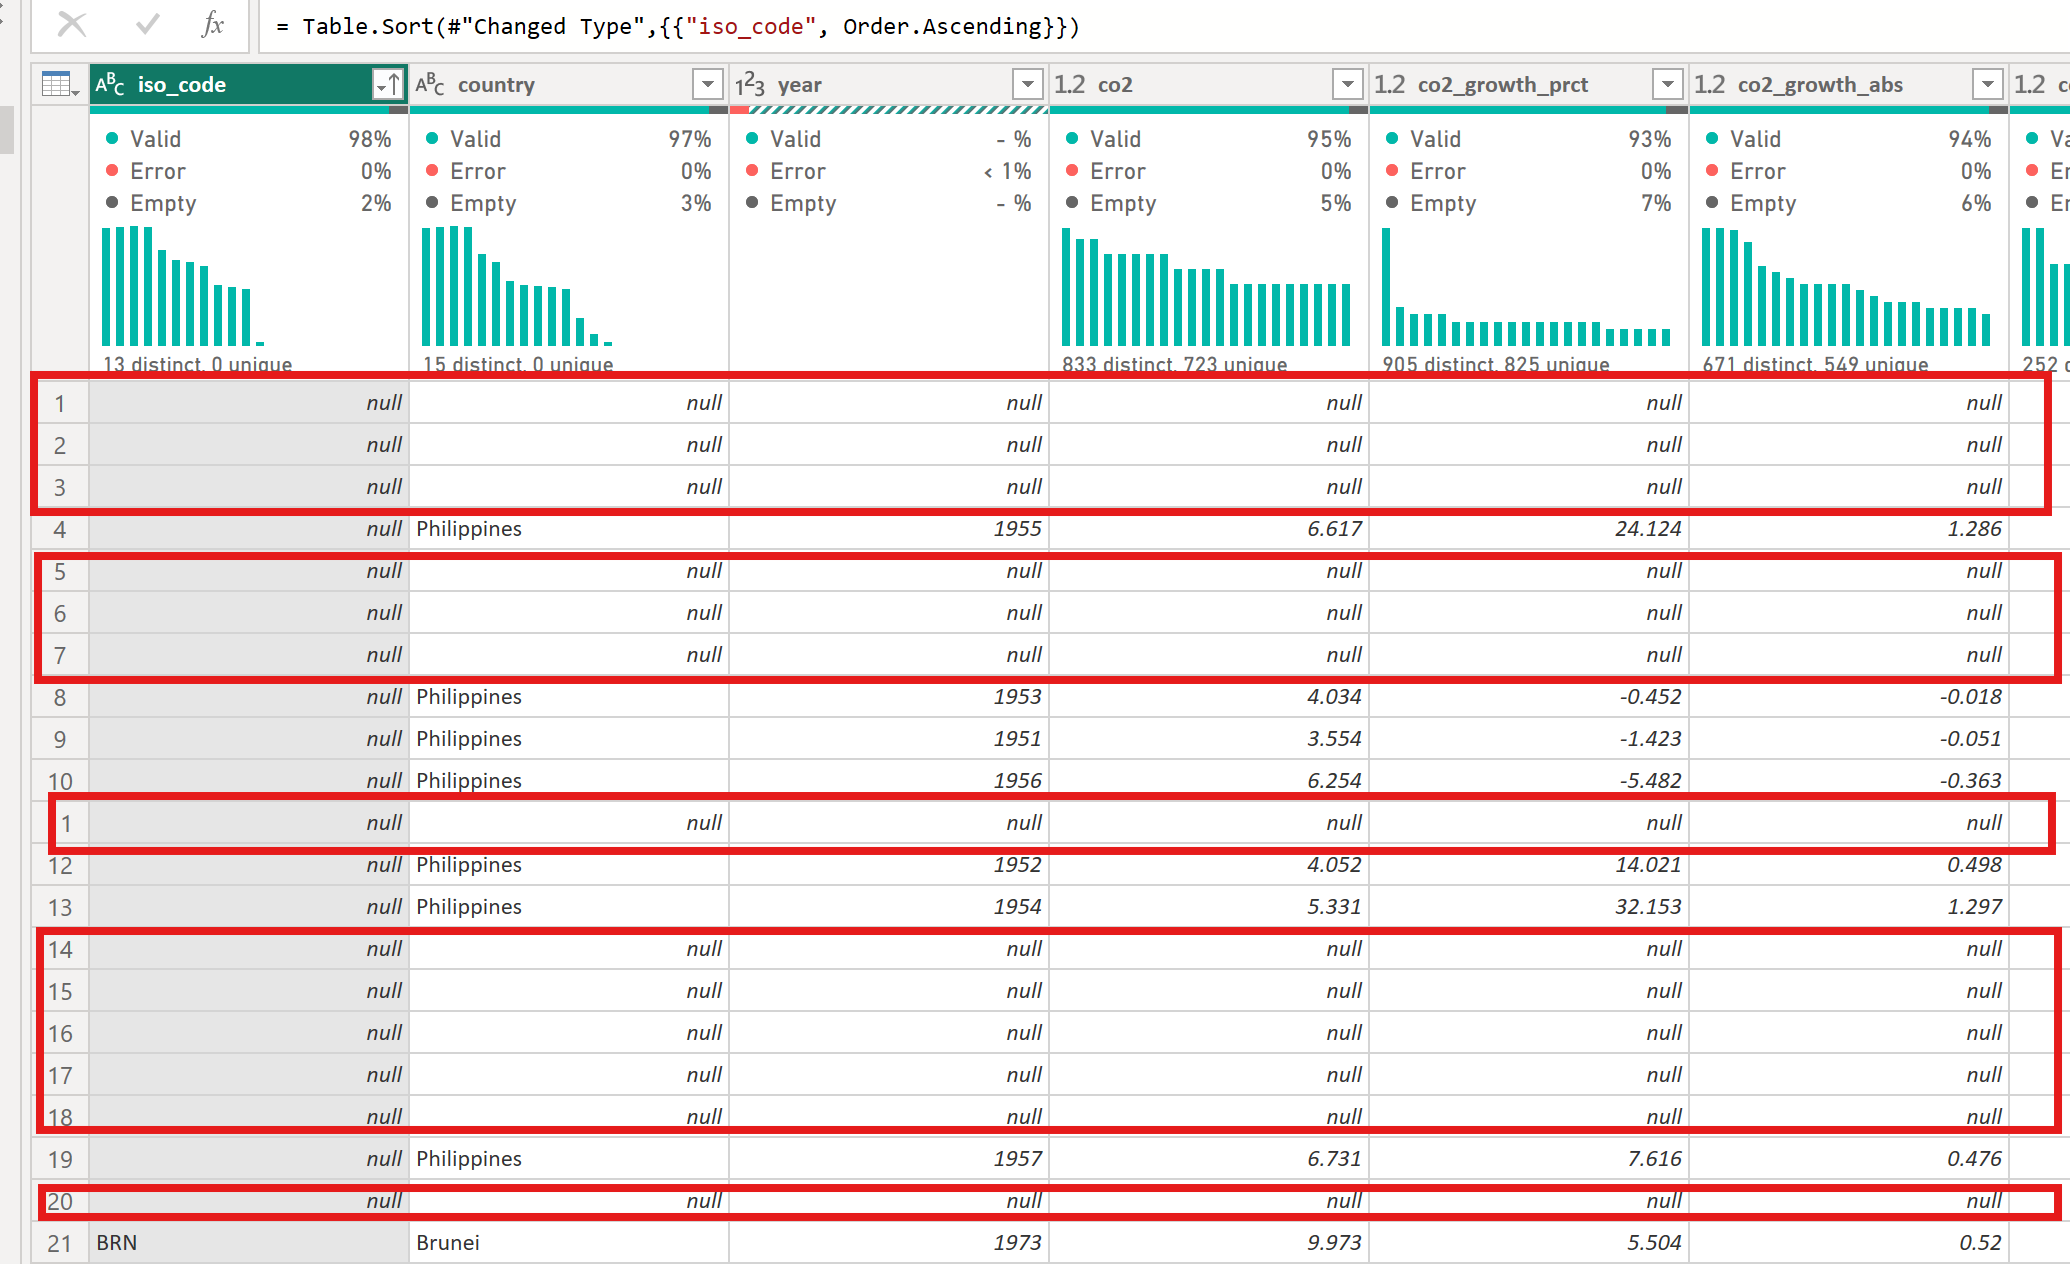
If you can retrieve info on missing contents per column, modify the dataset to include the info. (e.g. based on column 2, null values belong to Philippines. Replace null with PHL
Go to Home → Replace Values
[2] country
Observation
With 98% valid and 2% empty data Country with iso code THA is empty
Solution
Follow the same steps done in Column 1. If values are null but data are retrievable elsewhere. Modify the data (e.g. THA = Thailand)
Go to Home → Replace Values
[3] year
Observation
Data type is in whole number. Error is 100%

Solution
Go to Home → Keep Errors → Click on Error within the column to see details
Report detail says ** DataFormat.Error: We couldn’t convert to Number. Details: Year 1919 **
Close the last step on the Applied Steps section and change the Error into 1919
Right-click on the column name → Click the Replace Errors → Write 1919 as the replaced value → Close the Kept Errors on the Applied Steps
[4] flaring_co2_per_capita
Observation
With 6% Error
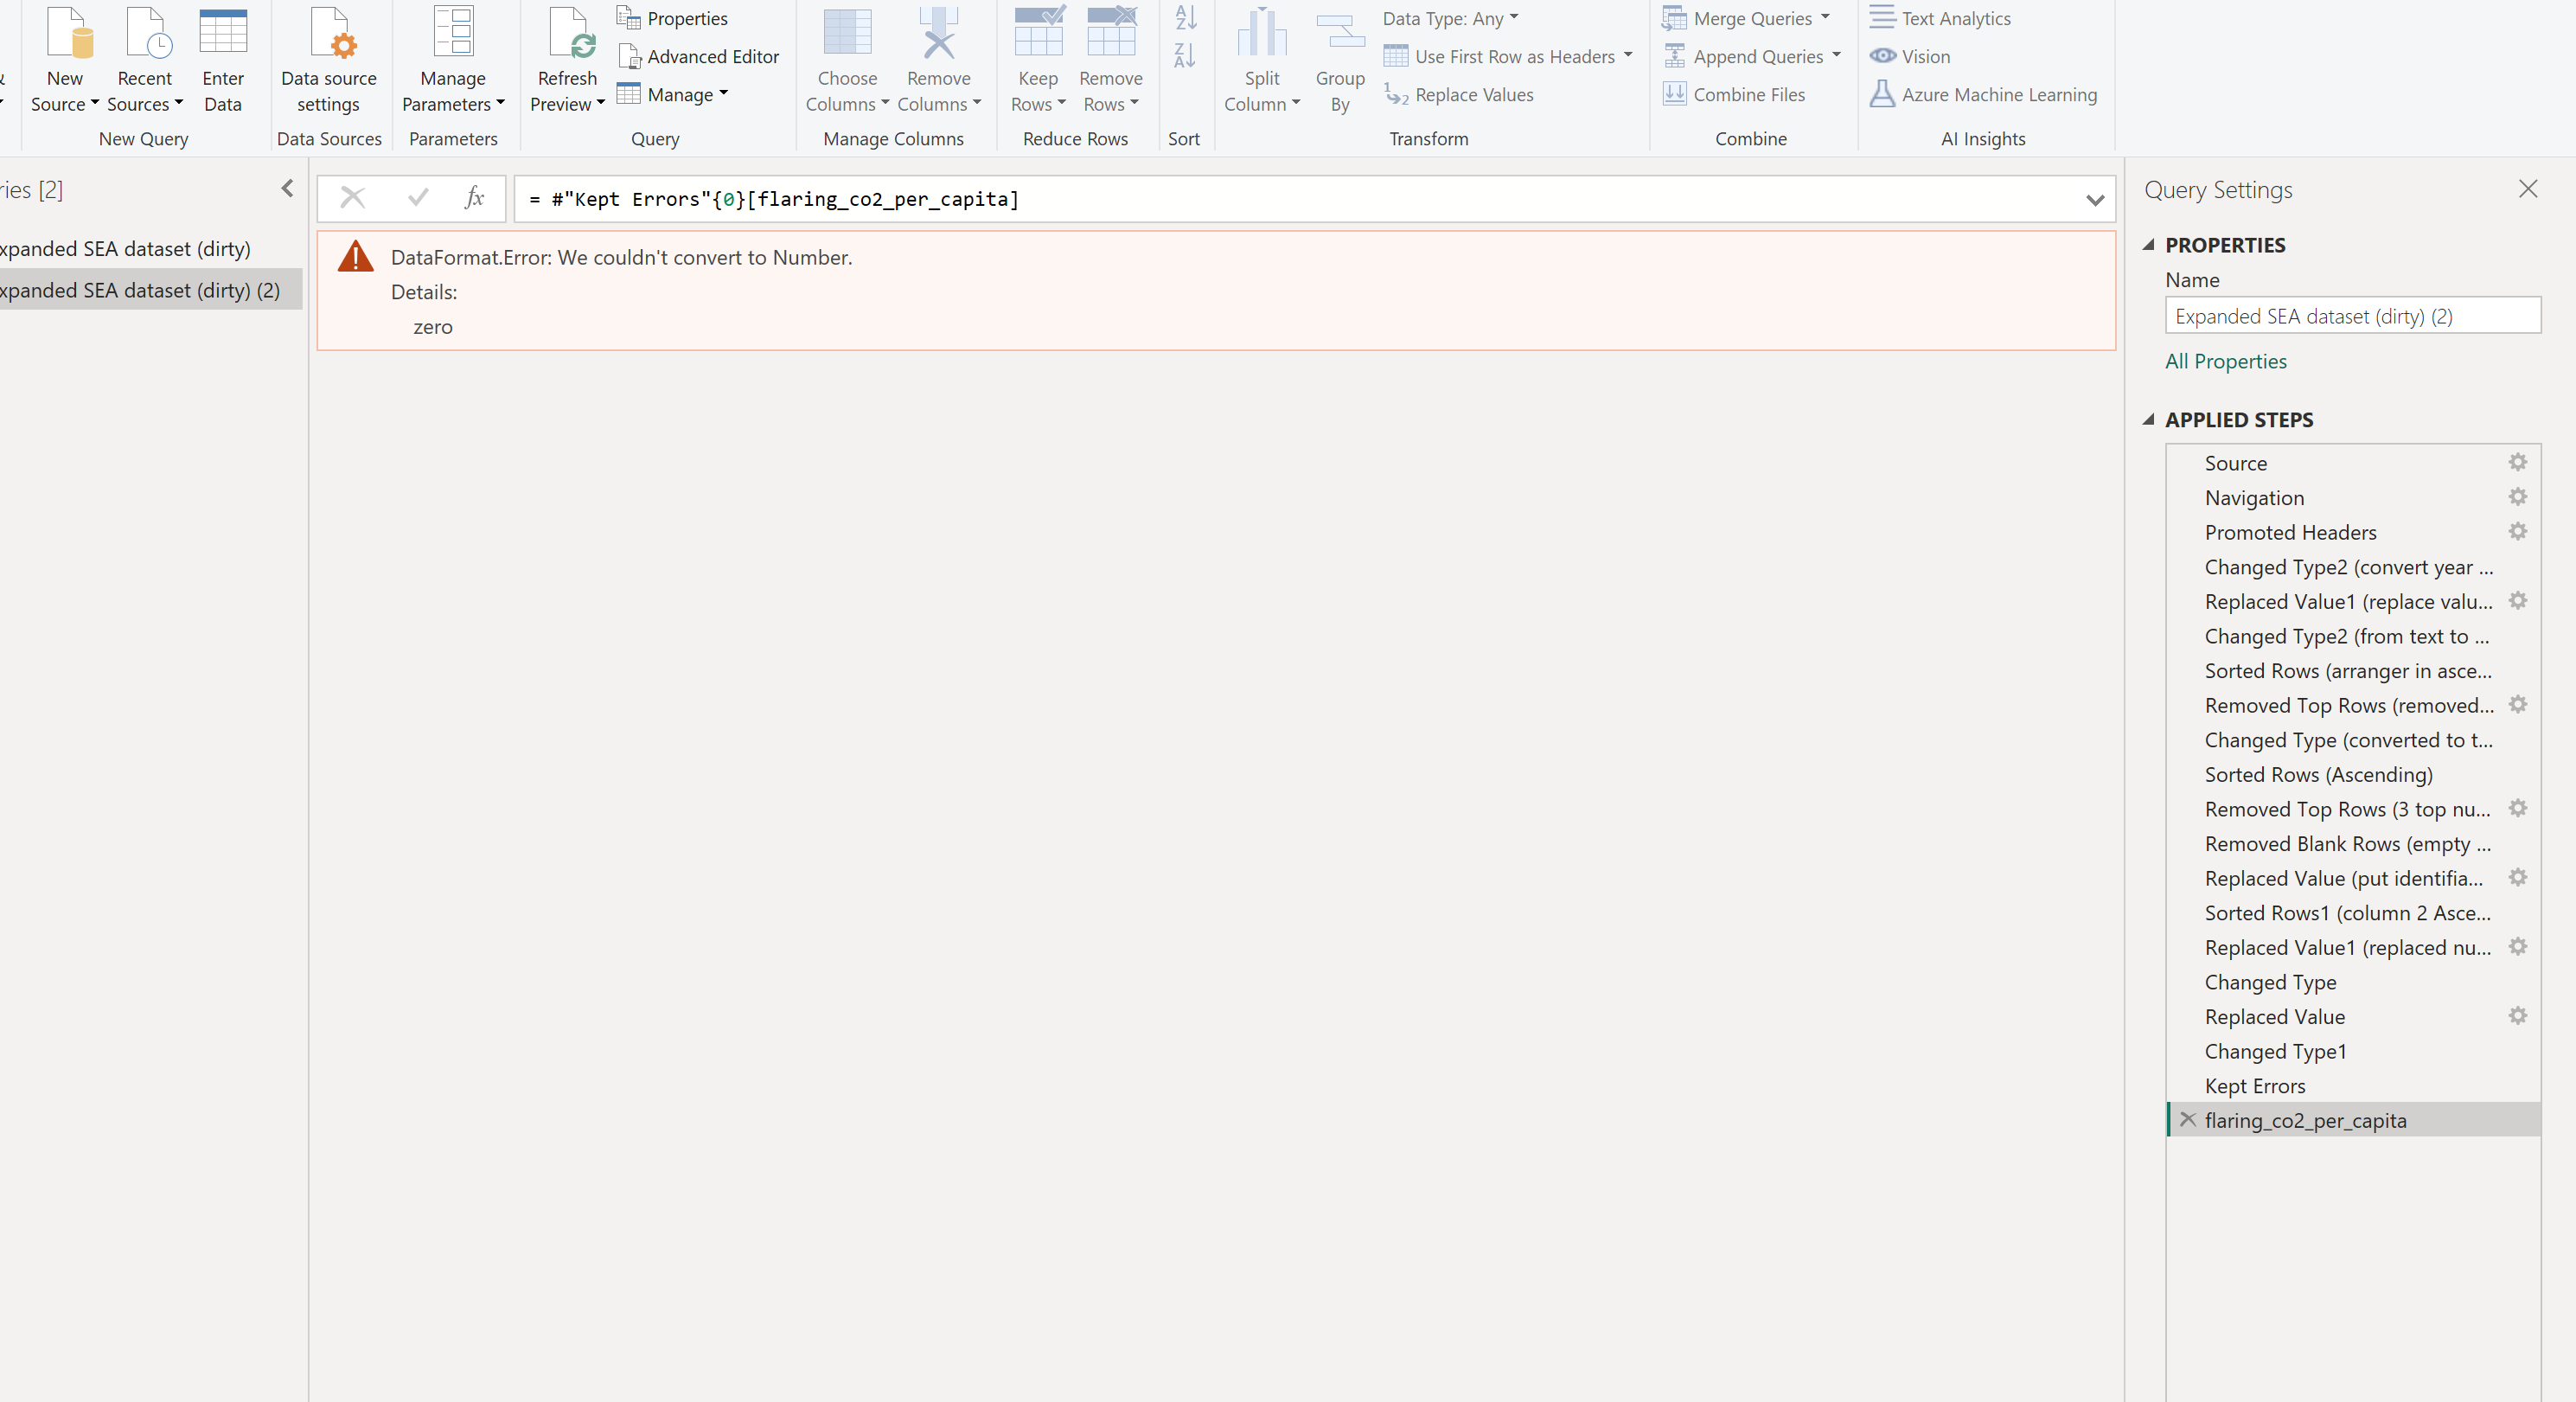
Solution
Sort in ascending order. ** DataFormat.Error: We couldn’t convert to Number. Details: zero **
Close the sorted by Rows step. Then go to Home → Keep Errors → Right click column name → Replace Error “zero” with “0”
Close Kept Errors
[5] population
Observation
Arranged data in descending order. We observed that some data has string data type (e.g. 118 thousand) and
Has negative values
Solution
Go to Transform → Replace Values; → Manually change strings into numerical equivalent
Sort data in descending order to check if strings are still present
Transform the negative values into absolute values
Right click on column name → Click Absolute Value
Recheck if errors persist. Go to Keep Rows → Keep Errors → Close the Kept Errors step
[6] region
Observation
Data column shows no % Error however,
Presence of Central Asia in the data. Recall the data background. This data should only report data from South East Asian regions.
If you look at the iso_code and country, almost all are located in South East Asia
Solution
Replace string value Central Asia as South East Asia
Go to Transform or right click then Replace Value
[7] income_group
Observation
Column categorized data into 3 groups: High Income, Lower middle income, Upper middle income but a null group was observed
null group falls under Philippines which is considered as Lower middle income group
Solution
Replace null with the correct categorization (Lower middle income)
Go to Transform → Replace Values → Input the correct values/strings
We’re almost done!
[8] Watch out for duplicates
Observation
Go back to the first column. Notice that LAO is duplicated. Highlight all dataset by selecting all columns from iso_code to income_group
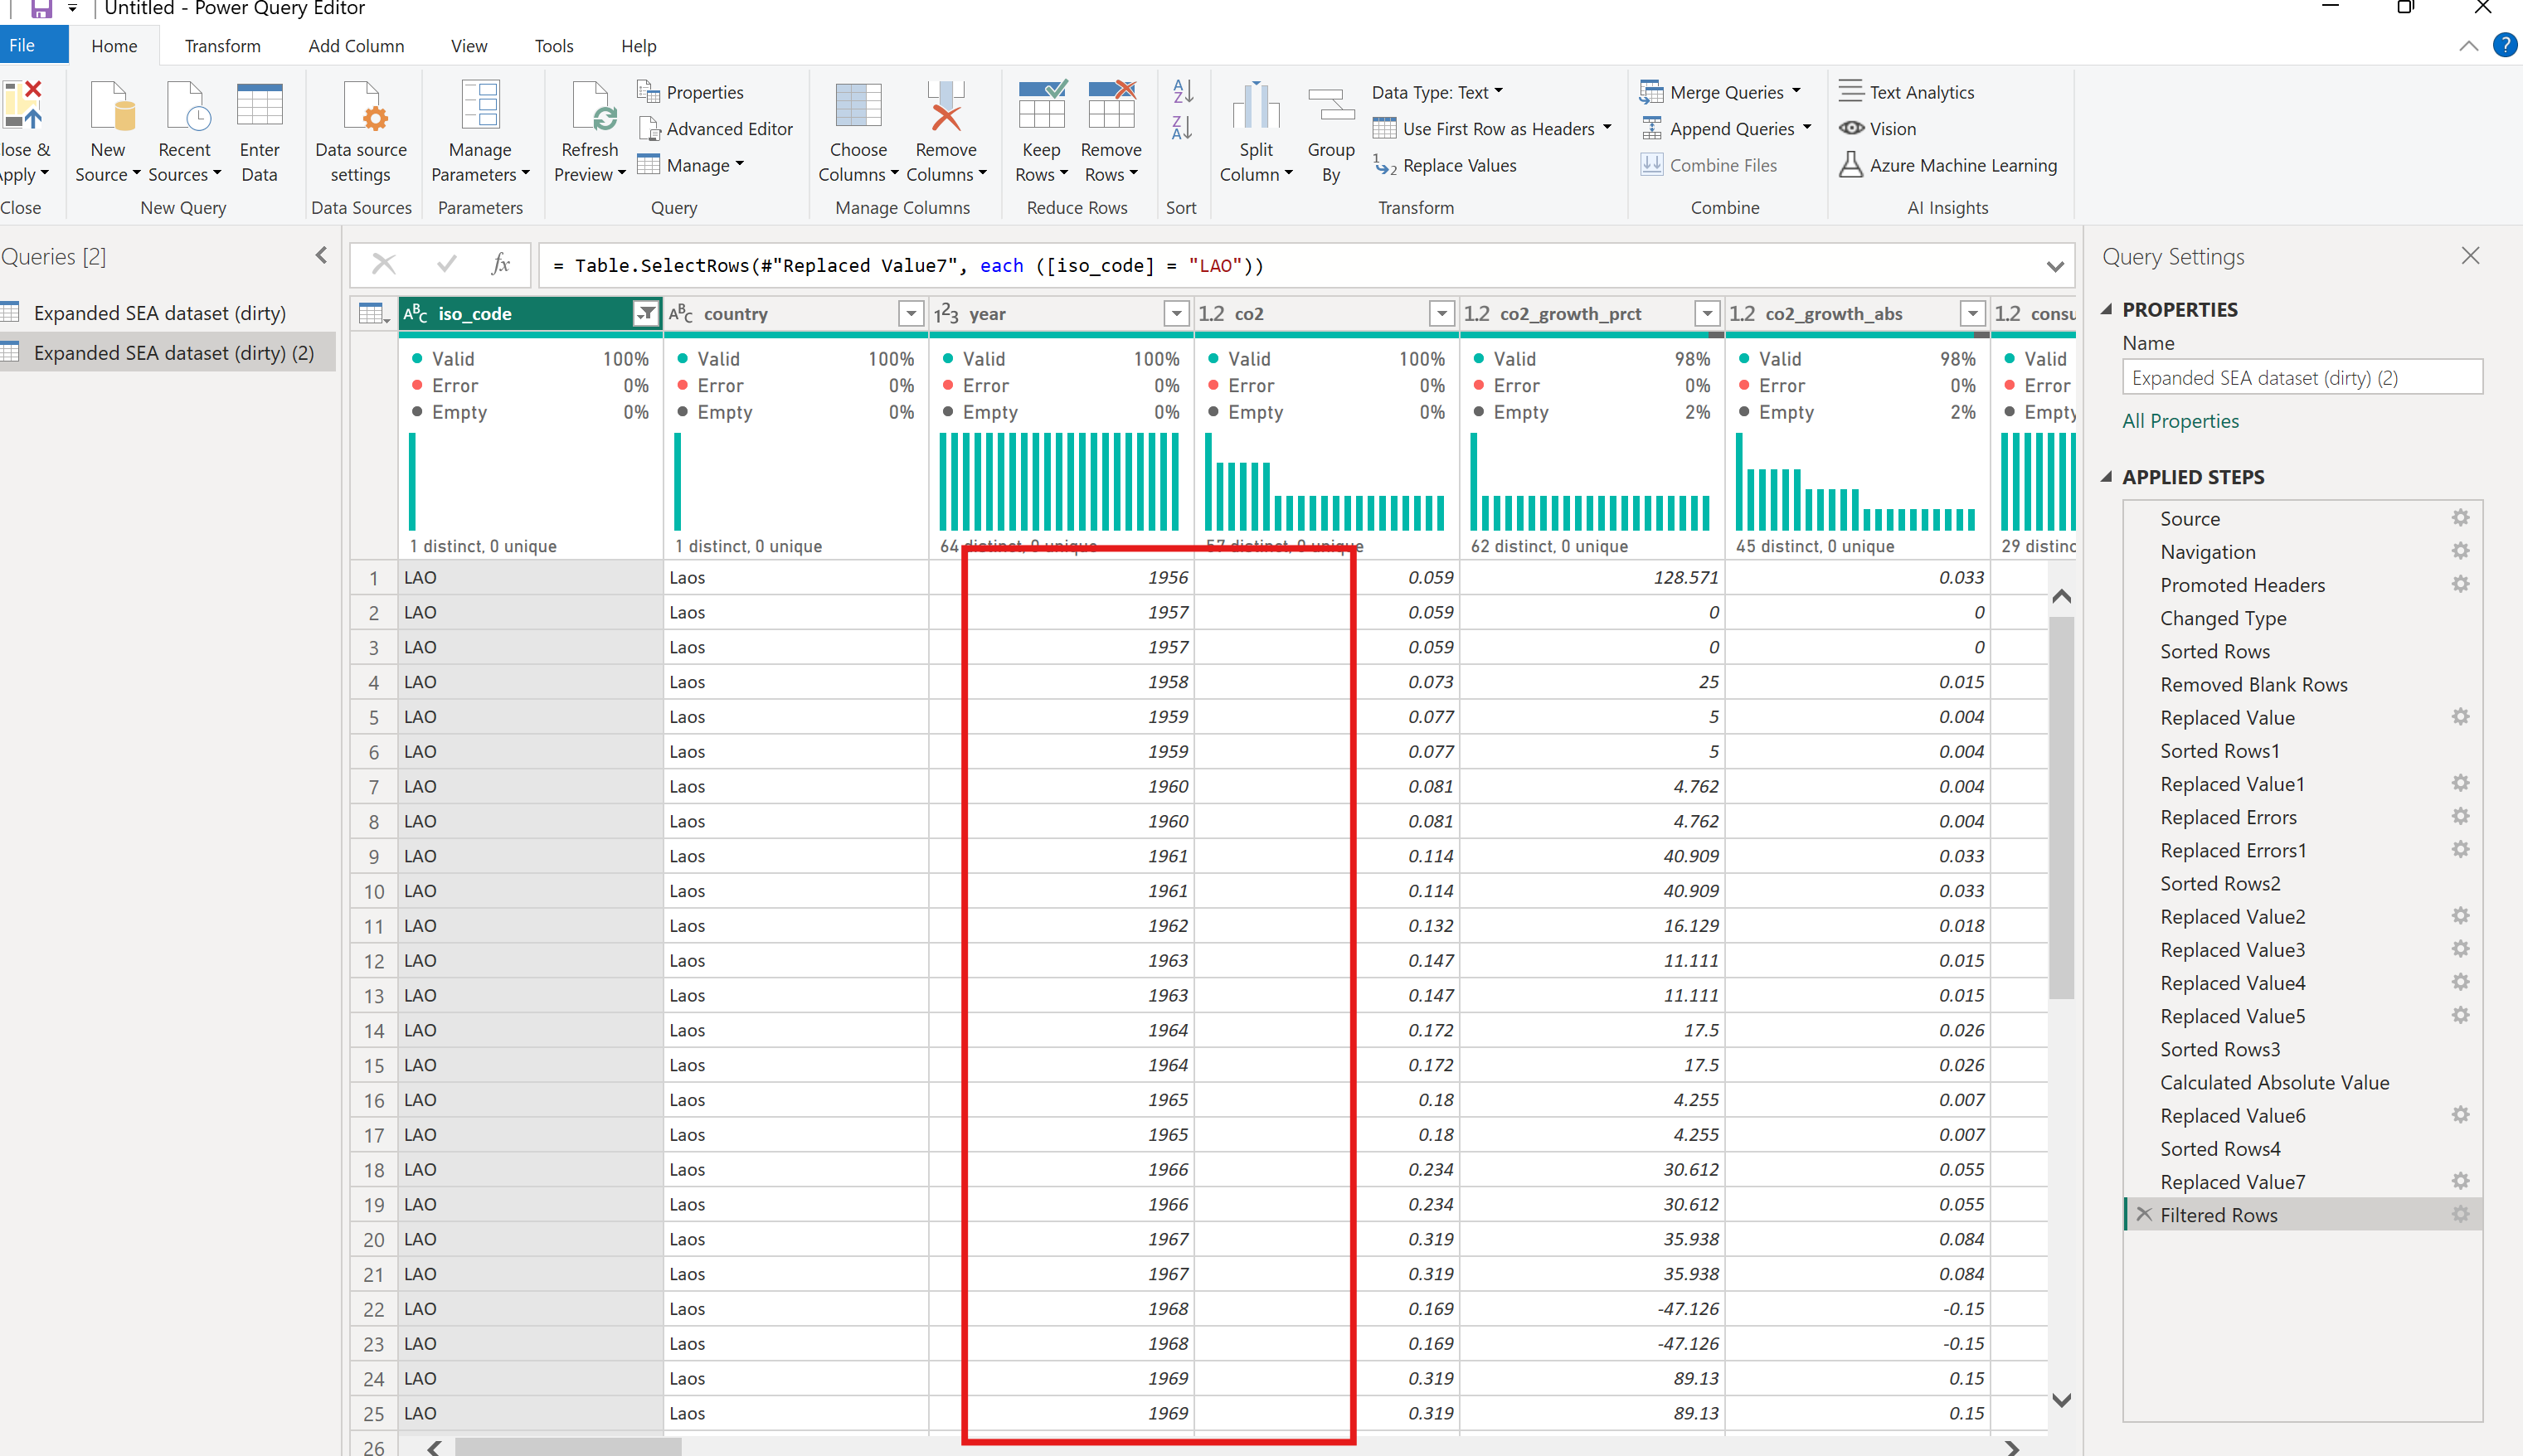
Solution
Then Right click on the dataset → Remove duplicates
Close the Filtered Rows on the Applied Steps
[9] Remove unnecessary data, outliers, or anomalies
Observation
EU is a different region. Obviously, not in South East Asia
Solution
Filter the data
Click the filter toggle button beside the column iso_code. Uncheck the box beside EU
Finally, Apply All steps by saving the Power Query
Save and Exit!
Bonus
Here is the list of steps used to dirtify the dataset

Take Away
Cleaning data is time-intensive but pivotal step in data analytics. We had to be keen checking for anomalies, missing values, duplicates, data format and types.
With Power BI, we prepared a clean, reliable, and format consistent data ready for analysis and visualization.
Acknowledgment
Special thanks goes to the Eskwelabs Team, Luigi (Instructor) and JC (Mentor) who shared time and expertise during our Data Analytics - Data Cleaning Sprint
ciao, I’m dozing off!